
Graphs
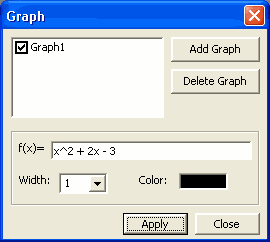
Graphs are created and edited in the Graph dialog box. The graphs are plotted according to the current grid settings. If the grid settings are changed the graph will automatically adjust to the new grid.
Open Graph dialog box


When you first enter the Graph dialog box it will appear as it does in the picture on the left. Before you can edit a graph's properties you must either create one or select one (if there are already graphs). To create a new graph, click on Add Graph.
Entering an Equation:
Equations are entered using a format common to most graphing calculators.
Parenthesis can be used to force the order of precedence. Only "(" and ")" are allowed.
Operators:
Add + Subtract - Multiply * Divide / Raise to power ^ Functions:
Absolute Value abs(n) Square Root sqr(n) Log (base 10) log(n) Natural Log ln(n) Sin sin(n) Cosine cos(n) Tangent tan(n) Note: All spaces are ignored.
Examples:
Equation Appearance Settings:
Make Graph Invisible: Uncheck the checkmark next to the graph name. To make it visible check it.
Change Graph Width: Click Width.
Change Graph Color: Click Color.