This page edits the general appearance of the grid.
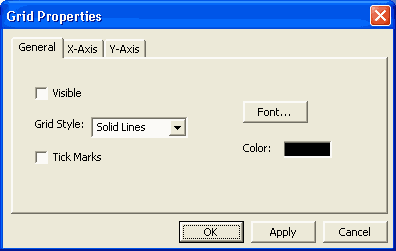
Visible: When checked, the grid is visible.
Grid Style: Sets the appearance of the grid lines or whether they appear at all.
Tick Marks: When checked, tick marks are drawn along the axis. (this is useful if you don't use grid lines)
Font: Sets the current font used for the axis numbers and labels.
Color: Sets the color of the entire grid.
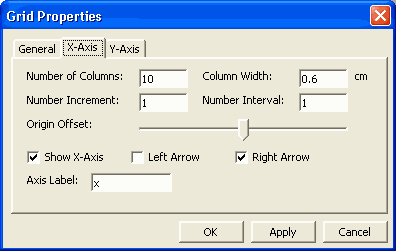
Number of Columns: Sets the total number of columns. The minimum and maximum values of the x-axis are automatically calculated using this value, the number increment, and the origin offset.
Column Width: Sets the actual size in centimeters of each column.
Number Increment: Sets the counting increment.
Number Interval: Sets the interval at which the axis is numbered. This only affects how the numbers are displayed. A value of 1 shows a number at every column. A value of 2 shows a number at every other column and so on. To turn off numbering make this blank.
Origin Offset: Sets the position of the origin. If it is zero (slider in the center) then the origin is in the center of the grid.
Show X-Axis: When checked, the X-Axis is displayed. (It is sometimes useful to hide an axis if you want to make a number line)
Left Arrow: When checked, displays the left arrow at the end of the axis.
Right Arrow: When checked, displays the right arrow at the end of the axis.
Axis Label: Sets the axis label.
The Y-Axis page works the same as the X-Axis page.